Reports is your cross-channel performance dashboard, giving you instant access to key rental metrics like total revenue, occupancy, nights booked, ADR, and revenue per booking — all in one place.
You can compare time periods, spot trends, and track the impact of pricing changes without needing spreadsheets or switching between tools. Reports are useful for property managers who need clear, consolidated data for quick decision-making and reliable reporting for owners, accountants, and business performance reviews.
Overview
The Overview page gives you a quick overview of your key performance metrics across all channels or for specific listings, including:
- Total Rental Revenue: The total income from your property.
- Average Occupancy rate: The percentage of available nights that were booked, averaged across one or more units.
- Total Nights booked: The total number of nights your property was booked.
- Average Daily Rate: The average amount you earn for each night your property is booked.
- Average Revenue per booking: The average amount you earn from each guest stay, no matter how long they stay.

Viewing Detailed Performance Data for Individual Listings
- Go to the All listings section.
- Select the listing you want to analyse.

- Choose a date range using the calendar tool.

- (Optional) Enable Compare to previous year to see year-over-year trends.

This enables you to monitor performance, identify seasonal trends, and make informed adjustments to pricing, availability, or marketing strategies.
1. Total Rental revenue

This report displays your total rental revenue over a selected period (in blue), compared to the same period in the previous year (in grey). It provides a month-by-month breakdown of the income generated from bookings. The value at the top (e.g. €96,393) shows the total revenue for the selected time range, along with the percentage change compared to the previous year (in this case, +23%).
This filter helps you:
- Identify your high and low seasons.
- Track how revenue changes month to month.
- View how individual listings have performed over time.
Recommendation:
- If revenue increases, identify what contributes to the growth (e.g. pricing, promotions, seasonality) and apply similar strategies across other listings
- If revenue drops, review your listing content and availability. Consider running promotions or improving visibility to boost bookings.
2. Occupancy rate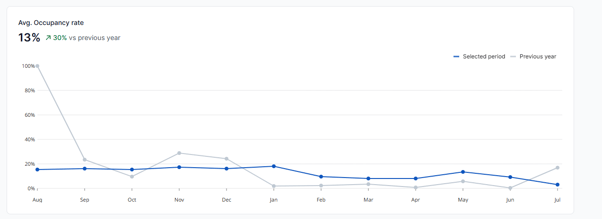
This line chart displays the average occupancy rate—the percentage of available nights that were booked—over a specific time period.
These filters help you spot patterns, make informed decisions, and adjust your strategy to improve occupancy and overall performance.
Tip:
- If occupancy is rising, continue with your current strategy and consider optimising your pricing to maximise revenue.
- If occupancy is declining, review your nightly rates, update your listing content, and consider promotional pricing or wider channel exposure to attract more bookings.
- If performance is flat: Try small experiments (e.g., dynamic pricing, special offers) and monitor changes using the report.
3. Nights booked

This chart shows the monthly total of nights booked, highlighting performance in the current period (blue) versus the previous year (grey). It offers a clear view of booking trends, helping you identify growth opportunities or areas that may need attention.
Tip: If bookings are dropping, review your availability, listing quality, or consider seasonal promotions.
4. Average Daily Rate (ADR)

This line chart displays the Average Daily Rate (ADR)—the average revenue earned per booked night. It helps you assess pricing trends and gauge how your property’s value is perceived over time.
5. Average Revenue Per Booking

This line chart shows the Average Revenue per Booking over time, calculated as the total revenue divided by the number of bookings. It reflects how much income you earn on average from each guest stay, regardless of length.
- If revenue per booking is increasing, keep your current strategy and consider offering upgrades or extras.
- If it’s dropping, review your stay lengths, discounts, or pricing.
- For inconsistent trends, check for seasonal patterns or outliers and adjust your strategy accordingly.
6. RevPAR (Revenue per Available Room-night)
This line chart displays your RevPAR — the average revenue earned per available night, whether it was booked or not. Unlike ADR (which only measures booked nights) or occupancy alone, RevPAR combines both into a single number that reflects how efficiently you're turning availability into income.
Formula: RevPAR = Total Revenue ÷ Available Nights
(or: ADR × Occupancy Rate)
For example, if your ADR is €150 and occupancy is 70%, your RevPAR is €105 — that's your true average income per night.
The chart shows your current period (blue) against the same period in the previous year (grey), so you can see whether your balance of pricing and occupancy is improving over time.

Tip:
- If RevPAR is growing year-over-year, your pricing and availability strategy is working. Consider applying the same approach to other listings.
- If RevPAR is declining, check whether it's driven by falling occupancy (prices may be too high) or falling ADR (you may be undercharging). Review the ADR and Occupancy charts alongside RevPAR to pinpoint the cause.
- Since there's no universal benchmark for RevPAR, the most meaningful comparison is against your own performance in the same period last year — which is exactly what this chart shows.
7. Revenue by Channel
This table breaks down your total rental revenue by booking channel — such as Airbnb, Expedia, Booking.com, Direct Booking, and others — for the selected period compared to the previous year. The Change column shows the percentage growth or decline for each channel.

The bar chart above the table gives a visual month-by-month view of total revenue across channels, making it easy to spot seasonal patterns and track overall performance trends.
This view helps you:
- Identify which channels are driving the most revenue and which are underperforming.
- Spot fast-growing channels (like a newly connected one) and decide whether to invest more in them.
- Compare direct bookings against OTA revenue to evaluate the impact of your direct booking strategy.
Recommendations:
- If one channel shows strong growth, check whether it's due to better visibility, pricing, or increased demand — and consider whether similar improvements can be applied to other channels.
- If a channel is declining, review your listing content, pricing competitiveness, and availability on that platform.
- A high share of direct bookings typically means lower commission costs. If you want to grow this channel, consider promoting your direct booking page or enabling a booking widget on your own website.
Click here to explore the Reports page.